




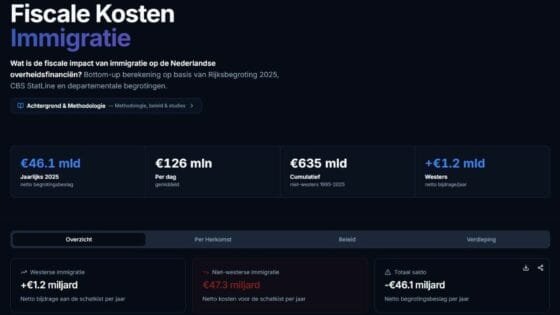
An anonymous website is fuelling anti-immigration campaigns by using AI to repurpose official Dutch statistics and court records as polarising propaganda.
The site, nederlandinbeeld.org, repackages information from dozens of public government sources and manipulates it to create a picture that distorts the impact of immigration on crime, housing and social security. It has arisen amid constant rioting, arson and bomb attacks on refugee centres.
The website has been spread through social media and is being cited as a source by Grok, the chatbot built into X. It does not disclose the identity of its owners or financial backers and tells visitors its figures are a direct transmission from official sources, shown “1:1, without AI interpretation”.
Its pages show that promise to be false at almost every turn. The site’s underlying database is built with an AI language model and reshapes the numbers, while purporting to compensate for a lack of government transparency on immigration.
Crime rates, housing, health and welfare costs, social perceptions and attitudes and even dress codes are broken down by ethnicity and set into comparative data analyses.
The national statistics office, CBS, from where much of the data is taken, told DutchNews that referencing its tables “does not imply that the derived figures are CBS statistics”.
AI-guessing ethnicity
At the centre of the site is a database of around 130,000 Dutch court rulings (though the site claims to use only 2,600). A language model reads each judgment and tags them with information the courts do not record – above all, the defendant’s ethnicity, which the site aggregates into tables of crime “per origin”.
The method may also be unlawful. Lotte van Schuylenburch, a media and privacy lawyer at the Amsterdam firm Boekx, told DutchNews that using AI to infer a defendant’s ethnic or national origin from court rulings may breach the EU’s data protection rules (GDPR), which bars the processing of data revealing racial or ethnic origin unless a specific exception applies. “In this context, it is difficult to see how any such exception would be met,” she said.
Dutch court judgments are anonymised: names, birthplaces and dates are blacked out before publication. The software cannot read what is not there. Instead, it scans the surrounding text for clues – like the country of birth left visible, a mention of an interpreter, or simply the name of a country that appears in the case – and records that as the defendant’s “origin”.
Those clues often describe the case rather than the person. “India” is a top-15 origin in the site’s database, tagged in around 500 rulings, but in 80% of them no form of the word India appears anywhere in the judgment. The mistake is probably from Dutch legal terms like indienen (to submit) that appear in nearly every ruling. In hundreds of other cases the software records asylum seekers as originating from Germany or France, when those are likely the destination countries.
The site’s database shows the guessing mostly fails: across all 130,000 rulings, the origin is recorded as “unknown” in 78.5% of cases. Every ethnic breakdown therefore rests on the minority of cases where the AI thought it found an answer, which are samples skewed towards foreign defendants, because a ruling tends to mention a country only when the case already revolves around it.
The rulings are not a neutral cross-section of Dutch case law. Around 66,000 are immigration cases, where the applicant is foreign by definition, and 48,000 are criminal, with the remaining 16,000 spread across social-security, family, tax and other administrative cases.
The figures beneath the headlines are tiny. A page on antisemitism is built on a handful of court cases. The honour-violence breakdown runs to single figures per country. Each is presented as a settled ethnic pattern.
Skewing housing and welfare figures
Where the site uses real data, it distorts it. On housing it states that 56% of family homes go to refugees. The figure is real, but, as CBS confirmed, it covers only one narrow category: a batch of roughly 4,500 housing-association homes allocated to first-time-renter couples with children, of which 56% went to households with a refugee.
Across all social-housing allocations the share is under 8%, and among couples with children 23%. CBS said the 56% had to be read with “the underlying definition of the group” in mind.
Refugees occupy about 2.2% of all social housing. Once they become Dutch citizens, CBS no longer counts them as refugees – but the site keeps a tally on former refugees as well, using the higher total of 7.8%.
Welfare works the same way, starting from a real disparity: people with a migration background are 28.5% of the population but about 65% of those receiving state support – an overrepresentation of roughly 2.3 times.
But that is a snapshot of when people are at their most dependent. CBS’s own cohort data shows benefit reliance among refugees falling from about 90% eighteen months after arrival to roughly a third seven years later. The table takes the early figure and makes it look permanent.
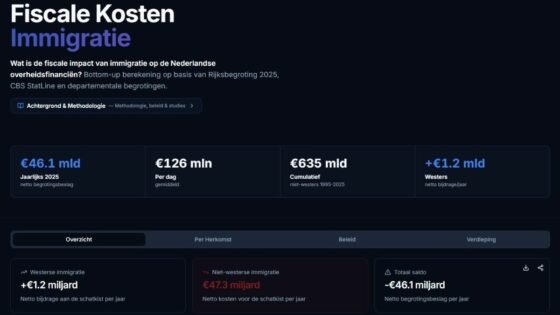
A “€46.1 billion a year” headline, presented as the net cost of migrants to the Dutch treasury, is the site’s own construction, not an official figure: it multiplies each line of the 2025 national budget by a CBS-derived “migration share” and sums the result.
The site’s methodology page shows this is a gross figure – what migrants draw from public services, before anything they pay in tax is subtracted – though the headline labels it “net”. The site’s page concedes a net calculation “leads to a lower figure”.
The €46.1 billion is then sliced up for effect: a €4,704 bill for each of 9.8 million workers, €188,160 over a 40-year working life, or, on another page, the same total divided by 5.1 million migrants for a starker per-head cost. It is dramatised as 30 weeks of food shopping or 55 petrol-station refills a year.
Skewing the crime figures
A tally of 266,896 “incidents” at asylum centres, taken from the reception agency COA’s own logs for 2015 to 2025, is presented as a crime wave, with incidents numbered on each asylum location on the map.
The site’s own labels show that around 60% are not even criminal offences but breaches of house rules such as smoking indoors and unclean rooms, that are marked “no neighbourhood impact”.
Around one in seven incidents were self-harm and suicide threats, which have risen as centres filled past capacity. Around 44% of the remaining incidents were verbal aggression and 35% were physical. The site then argues the real number is higher still, claiming most incidents go unreported.
The data also shows only a small minority of centre residents is suspected of a crime – 3% in 2025, according to the government research institute WODC, which found the rate stable since 2019, while around one in 10 was involved in an incident within the reception itself, most of it non-criminal.
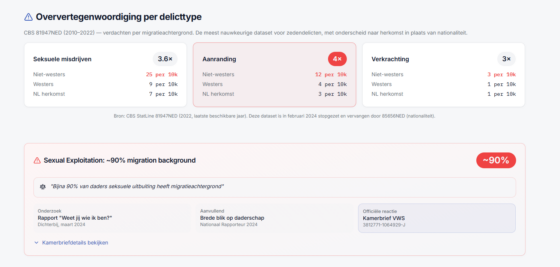
The same pattern is visible in sexual offences, where the site stacks different sources to give the impression of a single finding. Its headline “3.6 times” non-Western over-representation is drawn from a CBS table that was discontinued in 2024 and was based on the origin classification CBS abandoned in 2022 (Western vs. non-Western). It also counts suspects rather than convictions.
The correlations are real, but again misrepresented. A separate headline claim, that 90% of sexual exploitation is committed by people with a migration background, comes from a regional study of one offence (forcing people into prostitution) – but sits among the headline numbers as if it described all sexual crimes nationwide.
And the site’s own case table, drawn from published rulings, rests again on the AI origin-guess: of nearly 2,000 rulings it flags as sex offences, 83% carry no origin at all, so the ranking it prints, led by Turkey on 53 cases, is extrapolated from the remaining 17% and presented as a general figure.
“Replacement migration”
The site also includes population projections under the heading “replacement migration” that predicts how the demographic landscape will change as the migrant population grows. Again, the use of statistics is highly selective to create a picture of a country in which immigrants could be the dominant group in 2050.
It forecasts the share of the “native” Dutch population based on each political party’s migration policy, assigning them a “replacement factor” and leaning on the higher birth rate it attributes to non-Western residents.
To reach its numbers it counts the third generation as migrants, beyond the official CBS definition. The great replacement conspiracy theory has been a focal point of heated parliamentary debate recently, which the site also claims to reject.
It shows mainstream political parties like D66 and PRO as leading the country into a majority foreign population by 2050. The only party capable of keeping the Netherlands a majority “native” country by 2100, it shows, is the far-right FVD.
Policing the press
The site also runs a database scoring the “framing” of others – the refugee council VluchtelingenWerk, COA, the broadcasters NOS and RTL, and named journalists – against a checklist of statistical tricks: manipulating the denominator, omitting context, picking a favourable time-frame.
They are, almost exactly, the techniques the site itself uses. Its published roadmap states the aim: a “migration damage database” to build “the burden of proof for civil lawsuits against failed government policy”, a palpable political ambition for a site that says it has none.
One of a cluster
nederlandinbeeld.org does not stand alone. One linked site, migrantsnearme.com, maps the location and occupancy of more than 300 accommodation centres to the street level, drawn from an annex the then asylum minister, Mona Keijzer, released to parliament in September 2025; nederlandinbeeld hosts the same map.
Another, burgerwacht.nl, invites anonymous reports on neighbourhoods and lists nederlandinbeeld among its sources. Most of the data the sites run on is public, and released by the government itself.
The Ministry of Asylum and Migration told DutchNews it took seriously “the way in which this information is collected, combined and presented” by third parties, and was weighing further measures.
When we asked again whether anyone had assessed asylum seekers’ safety before the location data was published, it declined to answer. The COA said it was “not involved”. VluchtelingenWerk said much of the data was already public but said that, amid rising tensions, such sites “don’t help”.
None of the sites, including nederlandinbeeld, have responded to requests for comment.